Spend Analysis: Your first guide to effective action in Procurement
A Complete Step-by-Step Guide
What is Spending Analysis about?
Spend analysis is a powerful tool for companies looking to optimize their costs and make more strategic decisions. By identifying spending patterns and cost reduction opportunities, companies can improve their financial health and increase their competitiveness. Through data analysis, it is possible to identify trends, higher-than-normal spending, concentration of values in certain suppliers, categories, or even specific items with values that stand out.

Photo by Mikael Blomkvist on Pexels: https://www.pexels.com/pt-br/foto/marketing-cafe-copo-taca-6476805/
The phases of a complete spend analysis process are as follows:
1. Data Collection and Cleaning
- Data Generation and Consolidation: Gather all of the company's spending data into a repository, such as spreadsheets or a Business Intelligence system.
- Standardization: Ensure that the data is in a consistent format, with the same units of measurement, standardize the currency, and define the categories. It is very important to have a standardized date field that defines the period in which the purchase occurred.
- Data Cleansing: Identify and correct errors, inconsistencies, and duplications in the data.
A good spending database can be based on the purchasing documents (purchase orders) issued or the invoices registered by the finance department.
2. Categorization of Expenses
- Define a category structure that allows you to classify expenses in a detailed and consistent manner, so that you can obtain the maximum possible detail and increase the levels of detail in the analyses, from micro to macro.
- Assigning categories: Associate each transaction with one or more categories, such as supplier, product/service category, cost center, etc.
- Dividing purchasing data between materials and services, domestic and imported, approved and non-approved suppliers, contract or spot purchases is a great suggestion.
3. Descriptive Analysis
- Data visualization: Use graphs and tables to visualize the distribution of expenses by category, supplier, cost center and period.
- Identification of patterns: Look for trends, peaks and valleys in expenses, in addition to identifying the largest expenses and the largest suppliers.
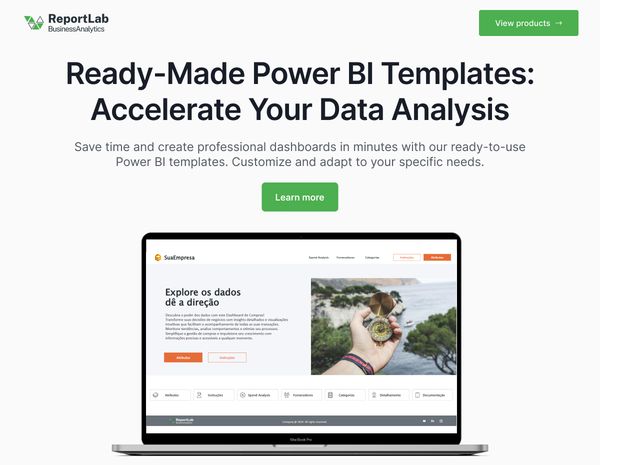
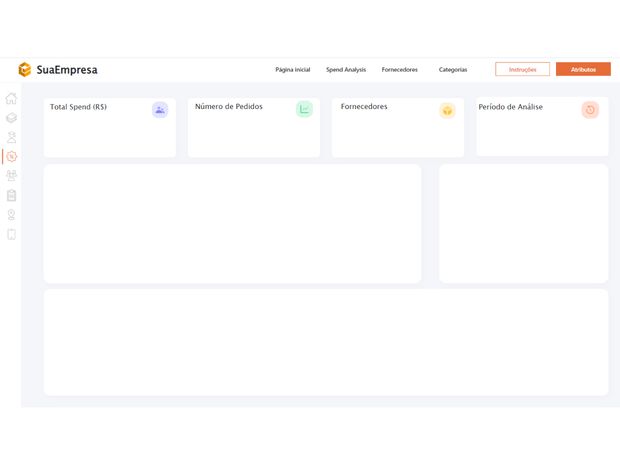
This is where a ready-made Power BI report template can help you!
Connect your database to ReportLab's Spend Analysis report to get immediate insights with the main visuals suggested based on storytelling concepts.
Our template also allows for comparative analysis: Compare current expenses with expenses from previous periods to identify variations and trends.
Check out the products available in the link at the end of this article.
- Benchmarking: Compare the company's expenses with those of companies in the same sector to identify opportunities for improvement.
- Then, move on to step 4.
4. Causal Analysis
- Identification of causes: Investigate the reasons behind variations in spending, such as changes in prices, purchase volumes, or new initiatives.
- Root cause analysis: Use tools such as Pareto analysis to identify the main causes of problems.
5. Definition of Actions and Implementation
- Identification of opportunities: Based on the previous analyses, it will be possible to automatically identify opportunities for cost reduction, process optimization, and improvement in negotiations with suppliers.
- Create specific action plans for each opportunity, with goals, deadlines, and those responsible.
Implement the action plans and monitor the results to ensure that the goals are achieved.
A great suggestion is to use the outputs of the spending analysis to develop a Kraljic Matrix to define specific action strategies for each category.
- The importance of purchasing (on the y-axis): analyzes the annual spend, the impact on profitability, and added value by product line.
- The complexity of the supplier market (on the x-axis): analyzes whether the supplier market is a monopoly or oligopoly, entry barriers, supply risk, costs and logistical complexity.

Kraljic Matrix by https://www.forbes.com/sites/jwebb/2017/02/28/what-is-the-kraljic-matrix/
Conclusion
Using this methodology to develop a purchasing strategy helps the buyer to better prepare for negotiations, better understand the supplier market and reduce costs.
Finally
Remember that cost analysis is an ongoing process. By conducting periodic analyses, companies can identify new opportunities for improvement and ensure that their spending is always aligned with their strategic objectives.
by ReportLab.com.br
![]()